Establishing a Framework for Evaluating Data Sources Quantitatively

Data has become one of the most critical assets in any business setting with significant influence on a business' success of failure. Ease of access to quality data enables business stakeholders to make accurate data-driven decisions and, depending on the timeliness of the data, gives an edge over competitors to take those decisions in a quicker and more strategic manner.
The value of the data you use does not lie merely in the information provided, it's also highly dependent on where you get this information from. The sources you choose to rely on could either hinder or build the credibility of your insights. Data sources could vary from Web scraping, API calling, Public Data Providers, Databases, etc. Accordingly, when multiple sources provide similar data, how do we choose the most suitable one?
As a Data Engineer (DE), you are typically responsible for extracting data from these various sources. The objective of this post is to establish a framework for DEs that assigns quantitative scores to Data Providers based on specific, predefined quality metrics. These scores are designed to align closely with the business's interests and reflect the priorities within its Data Domain.
At the end of the article, since we are an oil and gas company, we will be applying this framework on an oil and gas example. But for now, for illustrative purposes, let's assume we work for an athletics summary company tasked with identifying the world's top athletes to feature on our app, ProStats, which showcases their records and statistics. We are currently evaluating two hypothetical Public Data Providers as potential data sources: ProAthlete and AthlaWorld.
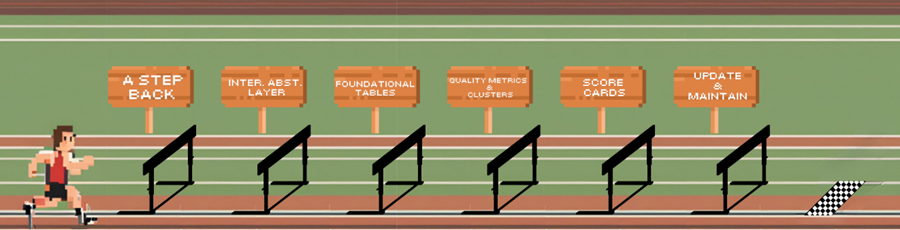
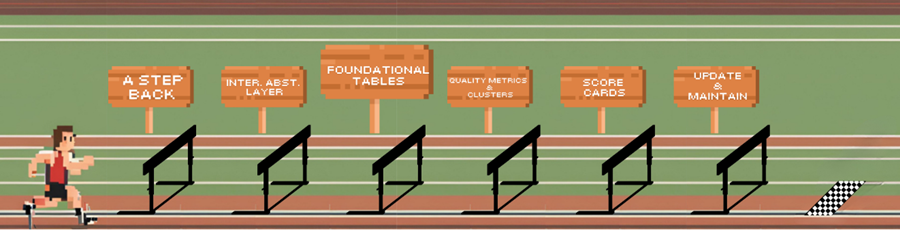
Taking a step back

Before evaluating any data providers, it's crucial to first turn the focus inward. We need to clearly define our business data needs, priorities, and expectations. What specific data do we require? What are our priorities when it comes to data quality, accuracy, and timeliness?
Establishing a well-defined and concise understanding of our data requirements is essential. These definitions should be objective, independent, and not tied to a particular data provider, ensuring that it remains applicable regardless of which provider/source we choose now or in the future.
A Data Dictionary serves as the central repository for our data requirements across its various data domains. It can be categorized into two primary entities:
- Attributes: An attribute is a single piece of information associated with a particular record—essentially, think of it as a column in a table.
- Dimensions: Dimensions are collections of related attributes that pertain to the same field of knowledge, much like the structure of a table.
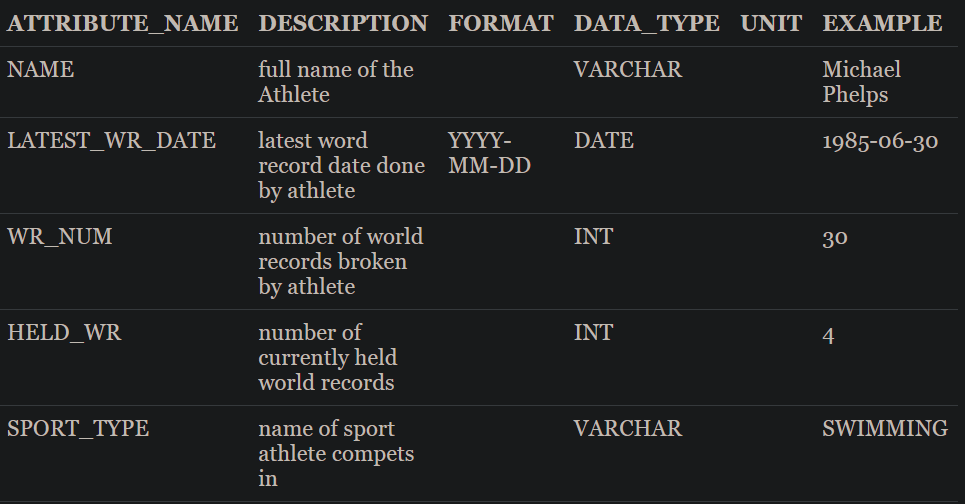
The Data Dictionary will likely consist of multiple Dimensions, each with its own distinct grouping of attributes. For example, we might have a dimension called ATHLETE_RECORDS, which contains attributes that describe an athlete's records throughout their career. As outlined in the table above, this dimension would include attributes detailing world record statistics, with a clear definition for each attribute, the required formatting, expected data type, and the applicable unit of measure.
Initially, a Data Dictionary can be built by reflecting the Dimensions and Attributes found within our organization's databases, BI dashboards, data warehouses, and other data sources. These sources provide valuable insight into our Data Domain and lay the groundwork for defining the necessary Dimensions and Attributes.
A well-constructed Data Dictionary should also facilitate collaboration across all teams and stakeholders in ProStats, allowing us to contribute to its development. This collaborative approach helps set priorities for each attribute and dimension, ensuring that the dictionary aligns with the broader business needs.
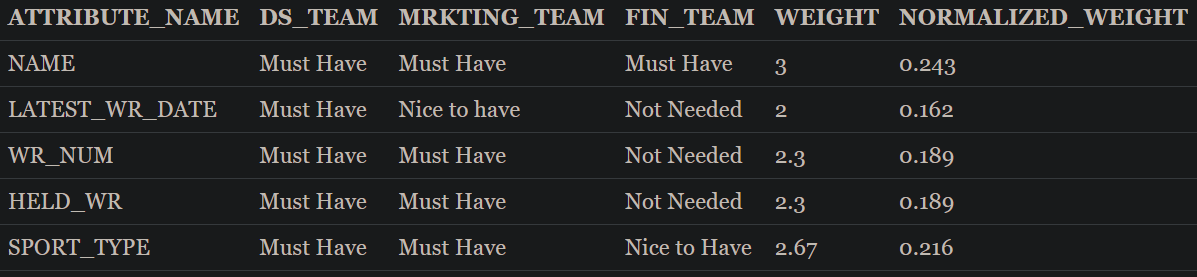
To enhance this process, interviews with business stakeholders can be conducted to capture their insights and translate their business terminology into specific attributes within the Data Dictionary. This ensures that the data needs and priorities of the business are properly reflected per team. These prioritizations can then influence the final scoring of each attribute and dimension—the higher the priority, the greater its impact on the overall score.
Attribute priorities could be defined as follows:
- Must have: is a deal-breaker if attribute is not available
- Nice to have: Has business value but not a deal-breaker
- Not Needed: not critical to have
each of those priority levels could then be assigned a number and averaged out to assign a weight to each attribute's score factor. For simplicity's sake, let's assign them as 3, 2, 1, respectively, with 3 as the highest priority and 1 as lowest.
It is important to note that the weighting process is not mandatory and might cause cloudiness to the final score's business meaning. It might sometimes make more business sense to give all attributes the same weight.
The Data Dictionary will function as a contract between the Data Engineering (DE) team and the business stakeholders, clearly outlining and aligning data expectations. For instance, if a marketing team member needs to know the number of world records currently held by an athlete, they should be able to find this information in an agreed-upon data storage location—such as a data warehouse. Specifically, they would look for it in the ATHLETE_RECORDS table, under the column HELD_WR, with the predefined data type and format.
Intermediary Abstraction Layer
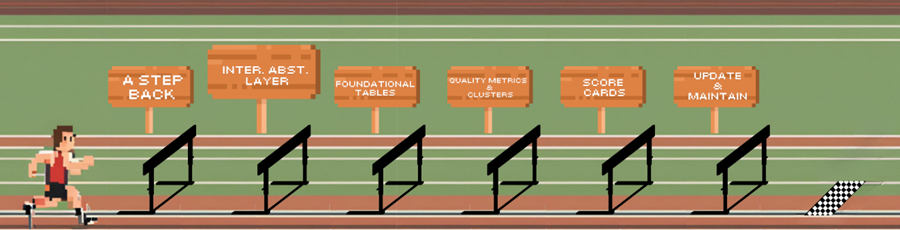
Now that we have clear definitions of ProStats' data requirements through the Data Dictionary, the next step would be to start mapping those Dimensions and attributes to both Data Providers, thus, creating an Intermediary Abstraction Layer (IAL). Since the data representation coming from both Data Providers will not necessarily be the same, the IAL will work as a common denominator between them, transforming them into a more familiar and agreed-upon representation, hence, facilitating an apples-to-apples comparison.
This process could be a simple one-to-one mapping between each attribute and its corresponding attribute found in the Data Provider or a complicated process where calculations are required to reach the exact format defined in the Data Dictionary.
For example, in the case of the NAME attribute, columns Athlete_name and Full_name could be found in our Data Providers ProAthlete and AthlaWorld, respectively, which will then be directly mapped to said attribute. However, for the attribute LATEST_WR_DATE, the required data might not be as readily available and necessitates a transformation operation for both Data Providers. The transformation could be in the following form, assuming that for AthlaWorld, there exists a table called WORLD_RECORDS that contains all athletes' world records:
SELECT ATHLETE_ID, MAX(WORLD_RECORD_DATE) AS LATEST_WR_DATE
FROM ATHLAWORLD.WORLD_RECORDS
GROUP BY ATHLETE_ID
This query would then be used to map the data from AthlaWorld to the LATEST_WR_DATE attribute. Similarly, a query for ProAthlete might also be required to map its data to the same attribute. This is merely a simplified example of how transformation operations could be used to map data coming from the Data Providers to our Data Dictionary, it is important to note that in other instances the queries could be higher in complexity.
The outcome of this step should result in two versions of the Data Dictionary, each populated using one of the Data Providers, reflecting the unique mappings and transformations required.
Foundational Tables
Now that we have the IAL set up, we could start performing some basic comparisons between the IAL tables coming from each Data Provider. In the Foundational tables (FT), we compare the most granular levels of data together for each attribute in all dimensions to set the stage for higher level scoring (next section, Quality Metrics). These comparisons could take many forms depending on the type of data to be compared.
Main Types of Comparisons
- String Comparisons:
To ensure accurate string comparisons, it is essential to perform string cleanups beforehand. This process helps eliminate unnecessary variations and ensures that only meaningful data is used for comparison. For example, Michael Phelps’ name might appear asmichael_phelpsin AthlaWorld and asMichael Phelps #in ProAthlete. Without cleaning, these variations could lead to mismatches during data comparison.
The cleanup process typically involves several key steps:
1. Remove special characters (e.g., underscores, hashtags).
2. Convert all letters to lowercase to standardize case differences.
3. Remove extra spaces to avoid formatting inconsistencies.
By applying these and other techniques, we can minimize data noise and improve the accuracy of string comparisons, ensuring that identical records are correctly matched across different data providers.
There are several Algorithms that could be implemented afterwards, such as, Levenshtein distance, Jaro-Winkler Similarity, along with many others, however, this topic is beyond the scope of this post so I will leave it to the reader's own discretion to decide which is most appropriate. - Boolean:
Boolean data are straightforward to compare as there only two possibilities, either they match or don't. - Enum:
Enum is not an explicit data type in a database, however, it does implicitly show up in many of the attributes. For example, when mapping the attribute SPORT_TYPE, we might imagine that there are only 3 types of sports: Swimming, Running and Cycling. These values could be considered as an enum and values coming from both data providers should be mapped to one of these three values. Similarly to Boolean, after mapping, comparison should be straightforward - Integers:
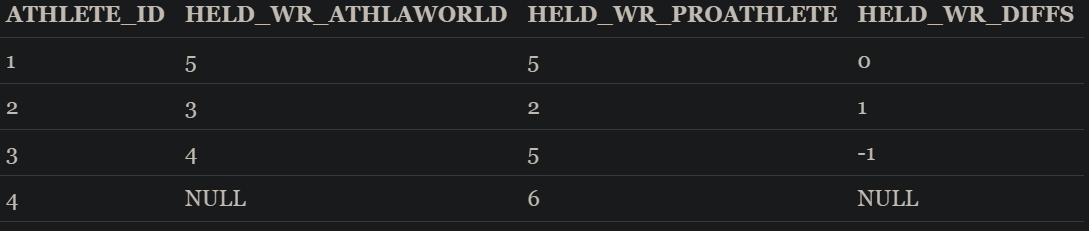
Integer comparison could be performed through a simple subtraction of attributes coming from both providers, in a consistent order. As an example, comparing athletes' world records recorded by both data providers using the formulaATHLAWORLD.HELD_WR - PROATHLETE.HELD_WR
would result in:
0 if both report the same number of Held world records
>0 AthlaWorld reports more world records
<0 if Proathlete reports more world Records - Dates:
Date comparison will be executed similarly to integers with the added step of needing to express the result in specific time units—such as months, days, or minutes.
The resulting Foundational table of the Dimension mentioned, ATHLETE_RECORDS should look something comparable to the following table
When the comparison done produces nondefinitive result, ex. string A is 70% like string B, it is important to define a tolerance threshold for each of these comparisons. For example, any string with less than 70% similarity will be considered mismatching. The threshold could be defined using statistical analysis technics by, for instance, defining the mean and standard deviation of the differences or calculating the z-score for the differences.
Quality Metrics and Clusters
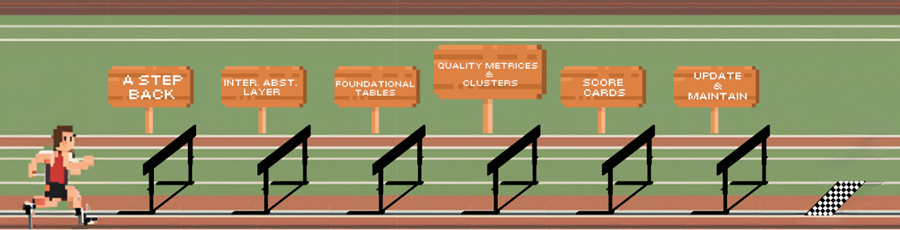
Quality Metrics
With all comparisons done and ready in the Foundational Tables, we need to utilize them in a way to describe the data coming from each Data provider through defined quality metrics. Each quality metric tests for a certain character in the data.
Generally, there are 3 main quality metrics:
Accuracy
Fundamentally, Accuracy is about identifying which data provider reports more accurate data for each attribute. However, calculating accuracy can be complex due to the challenge of determining the correct data source when discrepancies arise. When faced with mismatches between the two data providers, the possible scenarios are:
- AthlaWorld is correct.
- ProAthlete is correct.
- Neither source is correct.
Determining which scenario is right requires careful consideration. Here are three possible approaches to tackle this:
Using a Third Data Provider as a Tiebreaker:
- Introduce a third data provider as a reference point. If all three providers agree on a value, all are awarded a point for accuracy.
- If the two primary data providers (AthlaWorld and ProAthlete) disagree, but one of them matches the tiebreaker, the matching provider is awarded a point.
- If none of the providers match, none are awarded points.
- This point system can help quantify and score the accuracy of each provider.
Manual Verification with a Source of Truth:
- Define a small, representative subset of the data where disagreements exist between the two data providers.
- Compare this subset against a trusted, authoritative source of truth. For example, if evaluating the HELD_WR attribute, the Olympics website could be used as a reference.
- Although effective, this method can be time-consuming and labor-intensive due to its manual nature, especially for large datasets.
Leveraging Existing Organizational Data:
- Compare the data from the providers with information that already exists in the organization's data storage, such as data warehouses. This existing data has typically been vetted, reviewed, and used by Subject matter experts (SMEs) from within Prostats, making it a trusted reference point.
Using any of the mentioned approaches, each attribute should then have a score ranging between 0-1 representing the accuracy score of the Data Provider with respect to the attribute. Giving ProAthlete a score of 0.7 in HELD_WR means 70% of the data in this attribute was verified to be accurate.
Completeness
Completeness measures the amount of data in each attribute that lacks any business value. These values could range from nonsensical values, such as having an athlete with LATEST_WR_DATE set as 1300-01-01 or SPORT_TYPE set as NULL. However, it's important to note NULL or empty values should not always be regarded as incomplete values. For example, an athlete could have LATEST_WR_DATE set as NULL not because it is missing, but a result of not having any world records. Taking that into account, it is critical to identify what defines a record as incomplete for each attribute before performing any calculations.
Using the FT layer, each attribute should then have a score ranging between 0-1 representing the completeness score of a Data Provider for each attribute. Giving AthlaWorld a score of 0.9 in LATEST_WR_DATE essentially means that 90% of the data found in this attribute is of business value.
Timeliness
Not only is having data available in our Data Provider essential, but the time it takes for the Data Provider to deliver that data for processing by our pipelines is equally critical. Timeliness serves as a key measure of the data's relevance, reflecting how quickly the Data Provider can provide it for downstream consumption. Ensuring timely delivery directly impacts how current and actionable the data is for decision-making, making it a crucial factor in evaluating the Data Provider's overall effectiveness.
Unlike accuracy and completeness, timeliness operates independently of both IAL and FT layers. To measure timeliness effectively, a separate layer is established using Slowly Changing Dimension (SCD) Type 2 tables. This SCD layer will track attributes that we deem time sensitive.
The SCD layer will consume data from both Data Providers (Data Providers) and record three types of data events:
- Inserts: When a new record is made available by the Data Provider.
- Updates: When an existing record is updated to reflect the latest information, ensuring outdated data is replaced.
- Deletes: When a record is removed, preventing the use of obsolete data.
By comparing the movement of data within each Data Provider, we can gain a clear understanding of what to expect if they choose to subscribe to one provider over the other. For instance, if Michael Phelps breaks a world record, and AthlaWorld reports it within three days, but ProAthlete manages to report it within minutes, ProAthlete would have a significant edge in timeliness.
Since this metric is time-sensitive, it is crucial to set up the SCD layer early in the evaluation process to ensure that enough data is captured for meaningful analysis. This will allow ProStats to make informed decisions based on how quickly each provider can deliver actionable data.
Clusters
How many athletes in total throughout the 20th and 21st century do you think exist? Probably a couple of thousands of athletes. Unfortunately, not all of them are relevant in our current day and age. Now imagine when calculating the accuracy quality metric for both AthlaWorld and ProAthlete it was determined that they had 0.95 and 0.75 accuracy, respectively. Intuitively, our stakeholders would be racing to AthlaWorld due to their obvious edge in accuracy. However, one important thing to consider is what data is AthlaWorld 0.95 accurate in?
From those thousands of athletes, we are most likely interested in only the most recent and relevant current athletes to feature on our App, consequently, it would make sense to cluster the data provided by both Data Providers to only the athletes that conforms to our business needs. Let's assume as well that we are mainly interested in new current Events, thus excluding old irrelevant sporting events such as Standing High Jump and Walking Events. It would only be reasonable for us to limit our quality metrics checks to Clusters that would represent Athletes that are competing in the 21st century, defined as Cluster A and Athletes that are competing in currently held events, defined as Cluster B. Each of those clusters would then be assigned its own Quality metrics for each Data Provider.
After this clustering process, it could be the case that AthlaWorld and ProAthlete are in fact 0.80 and 0.90 accurate in Clusters A and B, respectively, giving ProAthlete the lead in accuracy in data that have business value for us.
Clusters could be as simple or as complicated as required to give the quality metrics accurate and relevant business meaning.
Score Cards
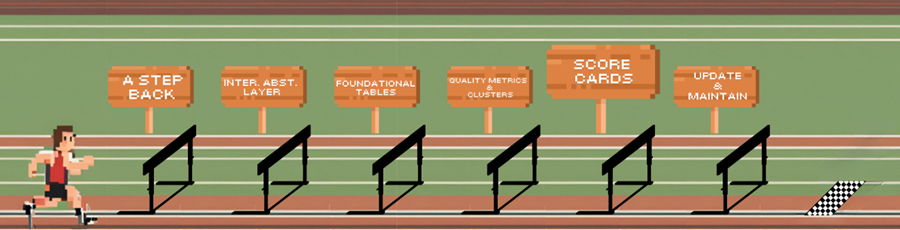
Presenting quality metrics in a way that’s both intuitive and easy to understand is just as important as the metrics themselves. For non-technical business stakeholders—those who will ultimately decide which data provider to choose—complex data needs to be distilled into a handful of key numbers that clearly communicate the pros and cons of each option. This is where the scorecard comes in.
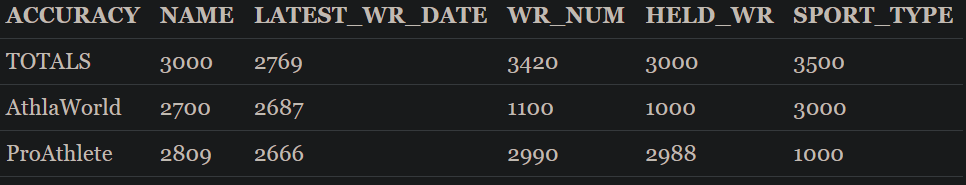
A scorecard serves as the perfect bridge between all the detailed technical work and the decision-makers. It could be as simple as an excel sheet with tabs for each defined dimension. In each tab, all attributes are listed as columns and each row contains the number of records scored by a provider. An additional row is also added to give the total population of data used to measure the attribute's quality metrics. An example for Accuracy would be as follows:
Using the table above, we could now calculate the accuracy of each Data Provider by dividing the Data Provider's row with the totals row, resulting in the following table
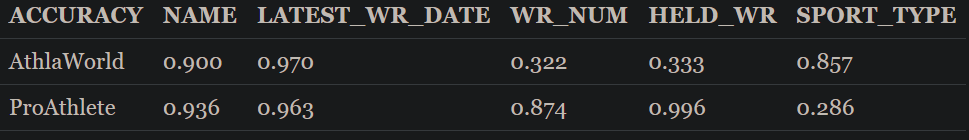
Now, referring to the weights we assigned to each attribute when first designing the Data Dictionary, we could perform a weighted average for each Data Provider's accuracy across all attributes in this dimension, for example, the results for ATHLETE_RECORDS dimension would be
AthlaWorld
(0.243)0.900 + (0.162)0.970 + (0.189)0.322 + (0.182)0.333 + (0.216)0.857=0.682416
ProAthlete
(0.243)0.936 + (0.162)0.963 + (0.189)0.874 + (0.182)0.996 + (0.216)0.286=0.791688
From those results, we could assume that ProAthlete would be better performant when it comes to accuracy in this dimension. The same process will then be repeated for each quality Metric per Dimension for every cluster. The end score card should be comparable to the following:
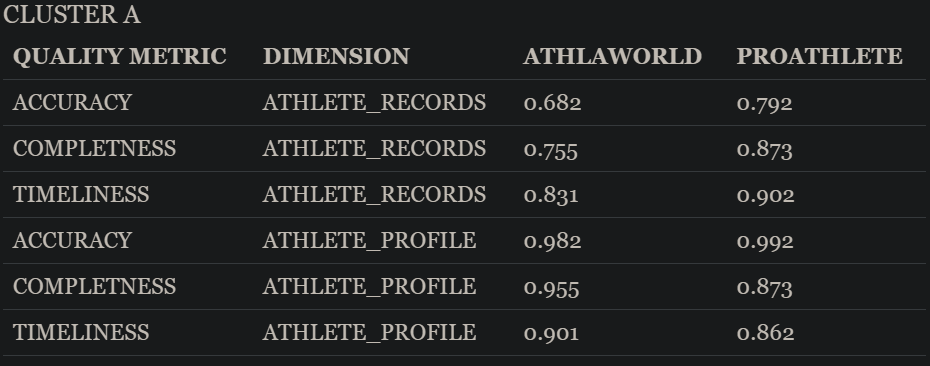
To simplify things further, all dimensions could be averaged to produce a single score per quality metric for each cluster. This would allow stakeholders to quickly assess overall performance at a glance. For a more detailed view, the scorecard could be structured in an accordion format, where each quality metric can be drilled through to reveal more granular results.
The scorecard could also contain other essential details, like contract prices, the effort required to integrate the Data Provider with ProStats systems, and the potential impact on existing infrastructure which will all factor into the decision-making process.
Update and Maintain

Maintaining the scorecard framework is essential to ensure that it remains relevant, accurate, and aligned with evolving business needs. Making sure that the data dictionary reflects new business data needs makes future reevaluation process easier and more readily available. The update and maintenance step could be done by:
- Keep Data Dictionary Up-to-date: As business needs evolve, new quality metrics or dimensions may become necessary. The scorecard should incorporate these changes as they become available. If a new attribute or dimension becomes critical, ensure it’s integrated, and that stakeholders are informed about how it impacts overall scores.
- Periodic Data Provider Evaluation: based on a predefined period, the framework should be used to reevaluate the currently used Data Provider and decide if a switch is necessary.
Wrapping Up
To bring this framework into the world of oil and gas, since we are an oil and gas company, let's consider how we might choose between two public data providers—Fofi and DellKalaTaste—for well data. Following the ProStats example's steps, we will need to start by defining our requirements first.
First, our oil and gas company would create a Data Dictionary that defines our expected dimensions and attributes:
- Header: General definitions and metadata related to a well
- Geometry: geometric characteristics of a well.
- Production: well’s production performance.
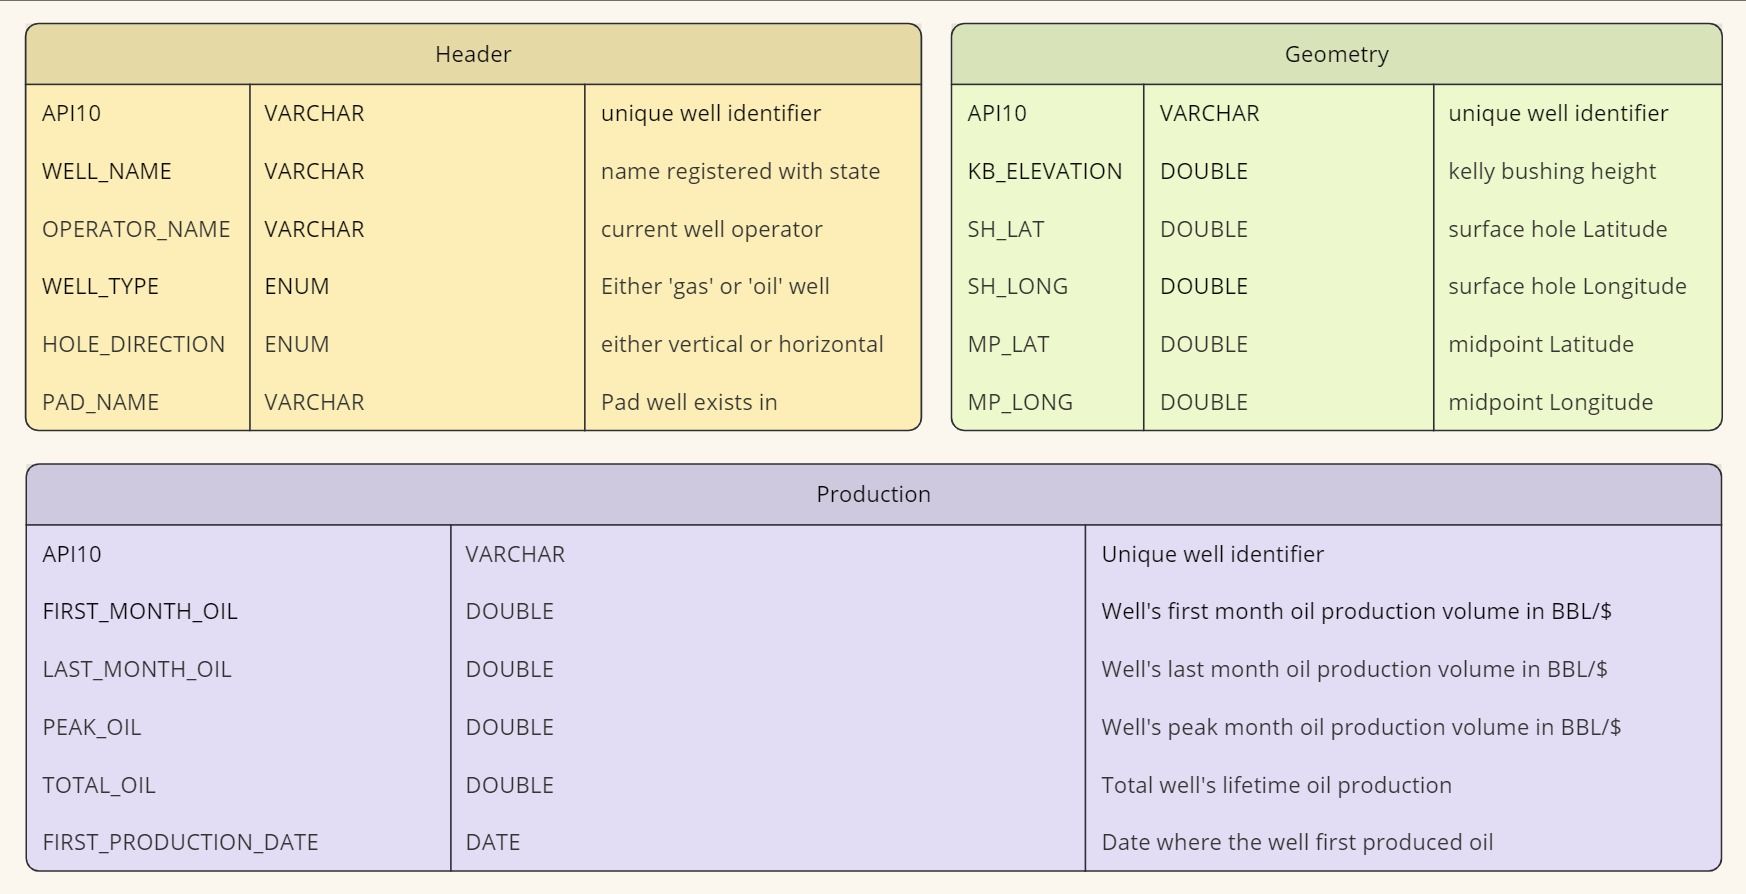
Data Dictionary
Due to its nature, we would then proceed to set up the SCD tables for the Timeliness quality metric to have sufficient time to gather useful and actionable data. Next, an Intermediary Abstraction Layer (IAL) would be built to harmonize the data coming from Fofi and DellKalaTaste, ensuring that comparisons are made on an apples-to-apples basis. For example, the WELL_NAME attribute from both providers would be mapped to a common format in the IAL, making it easier to compare.
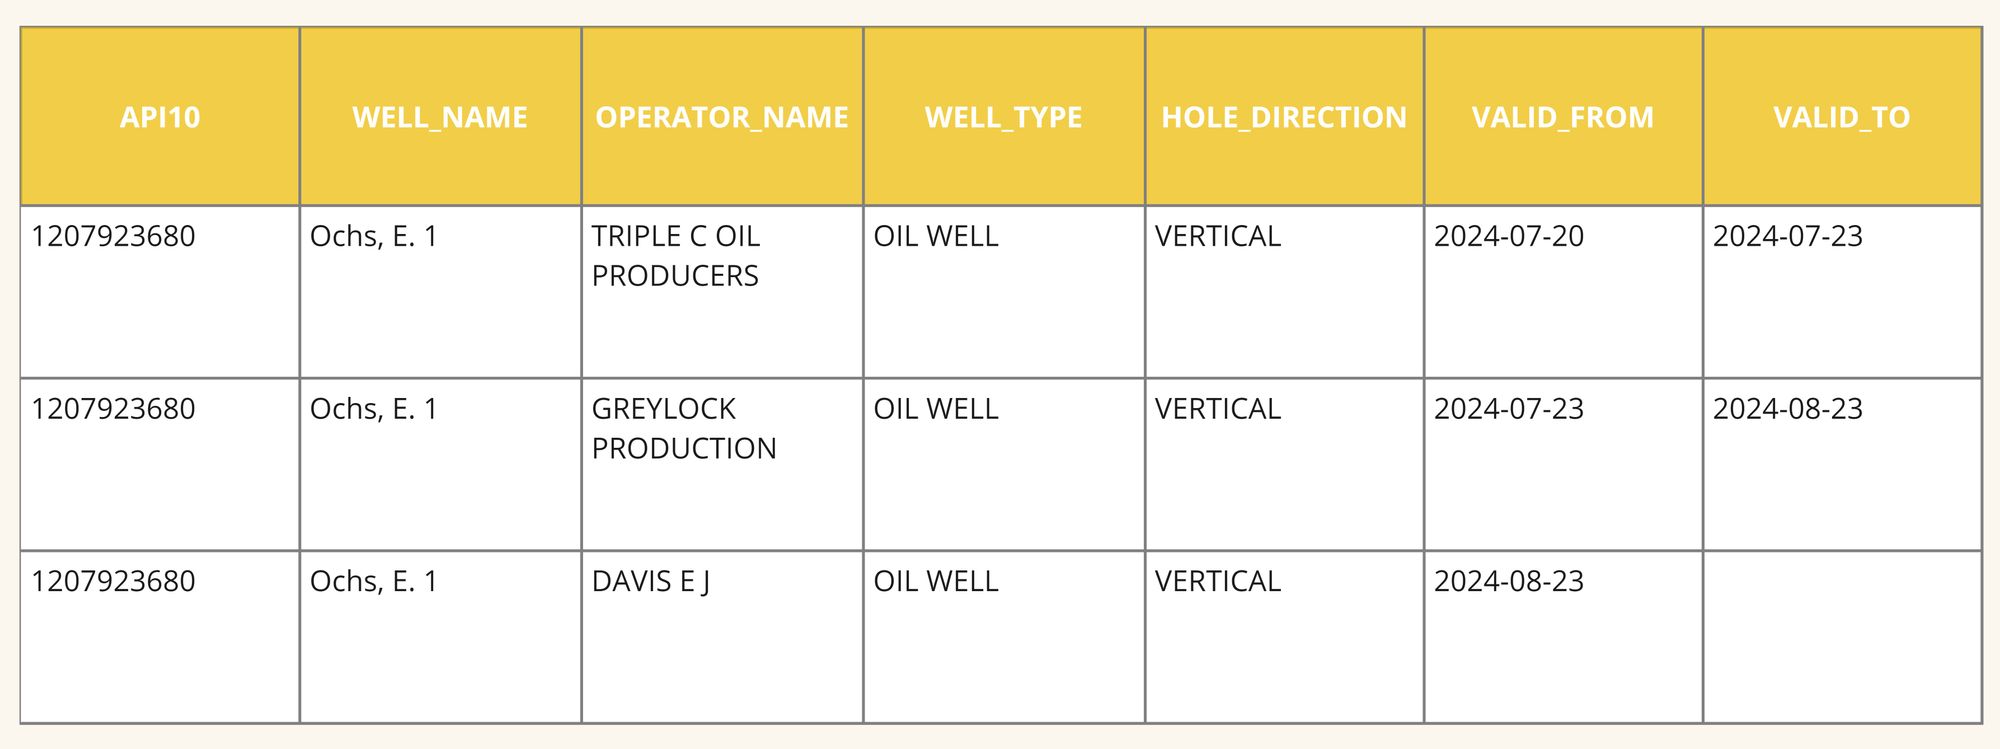
SCD Table Example for Header
Once the IAL is set up, we would start comparing the data using Foundational Tables (FT). These tables would perform comparisons between the attributes of each dimension, such as evaluating how accurately each provider reports well locations or production volumes. Comparisons would be tailored to the data type, using algorithms for string matching, integer comparisons, or date comparisons where necessary. Moreover, using the SCD tables, we would then calculate and compare time span for each Data Provider to insert new wells or old well's data, such as production data, update outdated data or deleted irrelevant data. This will serve in calculating the Timeliness quality metrics.
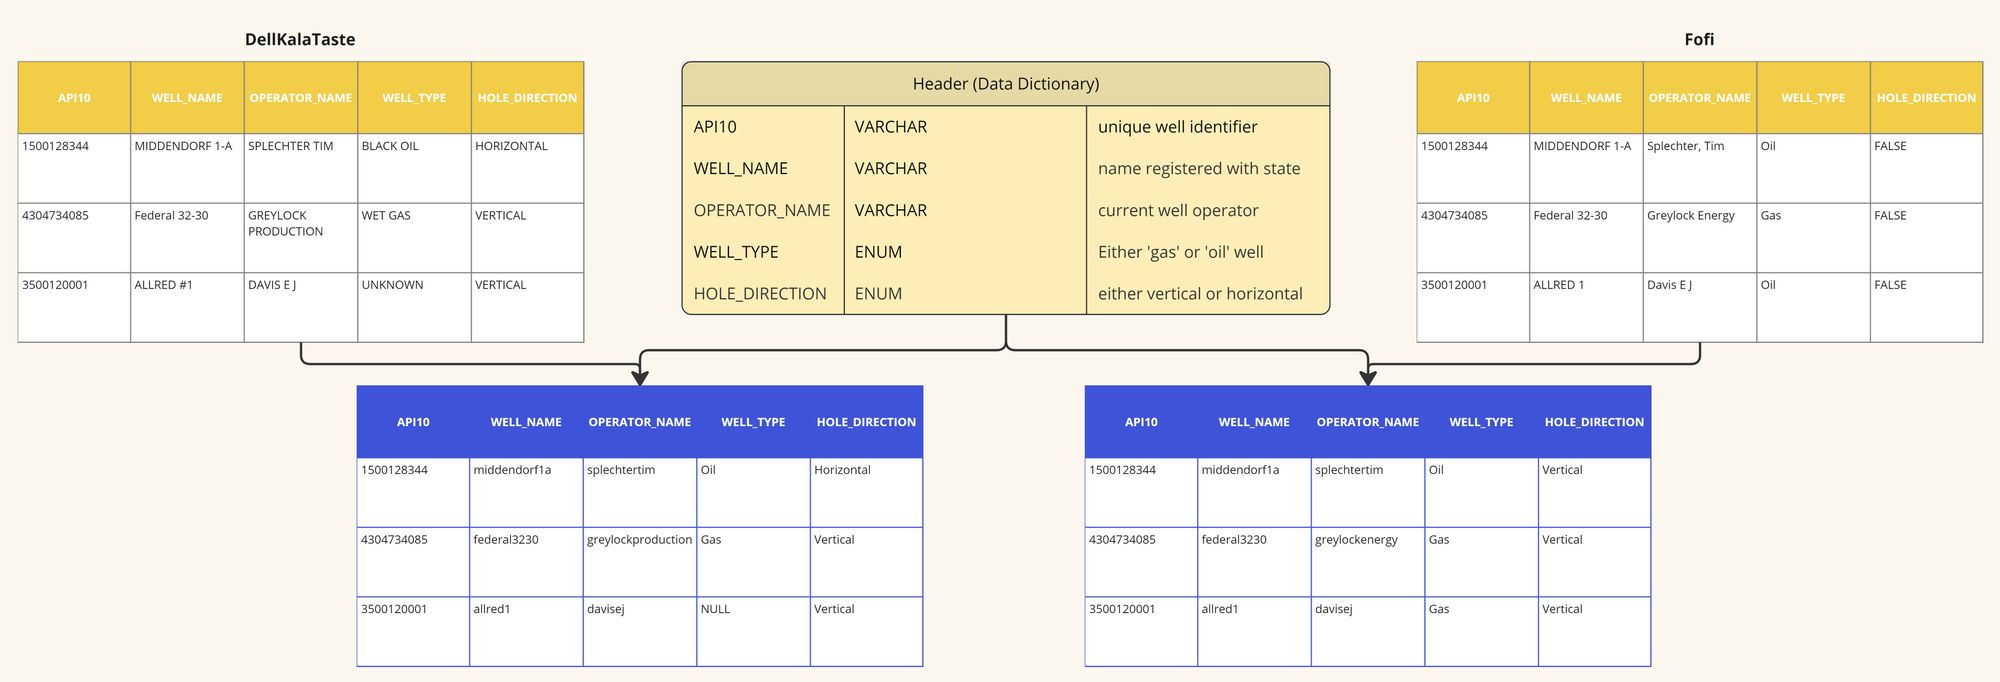
Intermediary Abstraction Layer for Header
Reflecting on the business needs and requirements, we could group the wells into the following 2 Clusters:
- Cluster A: defined as all well that our company owns in, as it is critical to have the correct information about our wells
- Cluster B: defined as all horizontal wells existing in the Permian Basin assuming that we as a company are only interested in buying wells in this basin
The results of these comparisons grouped by the defined clusters would feed into Quality Metrics such as Accuracy, Completeness, and Timeliness. For example, accuracy could be measured by comparing well production data from both providers with a trusted third source, like internal records of owned wells. Completeness would evaluate how much useful data each provider delivers, while timeliness would measure how quickly new data becomes available.
Finally, the scores would be aggregated in a Scorecard. For example, Cluster A would look like:
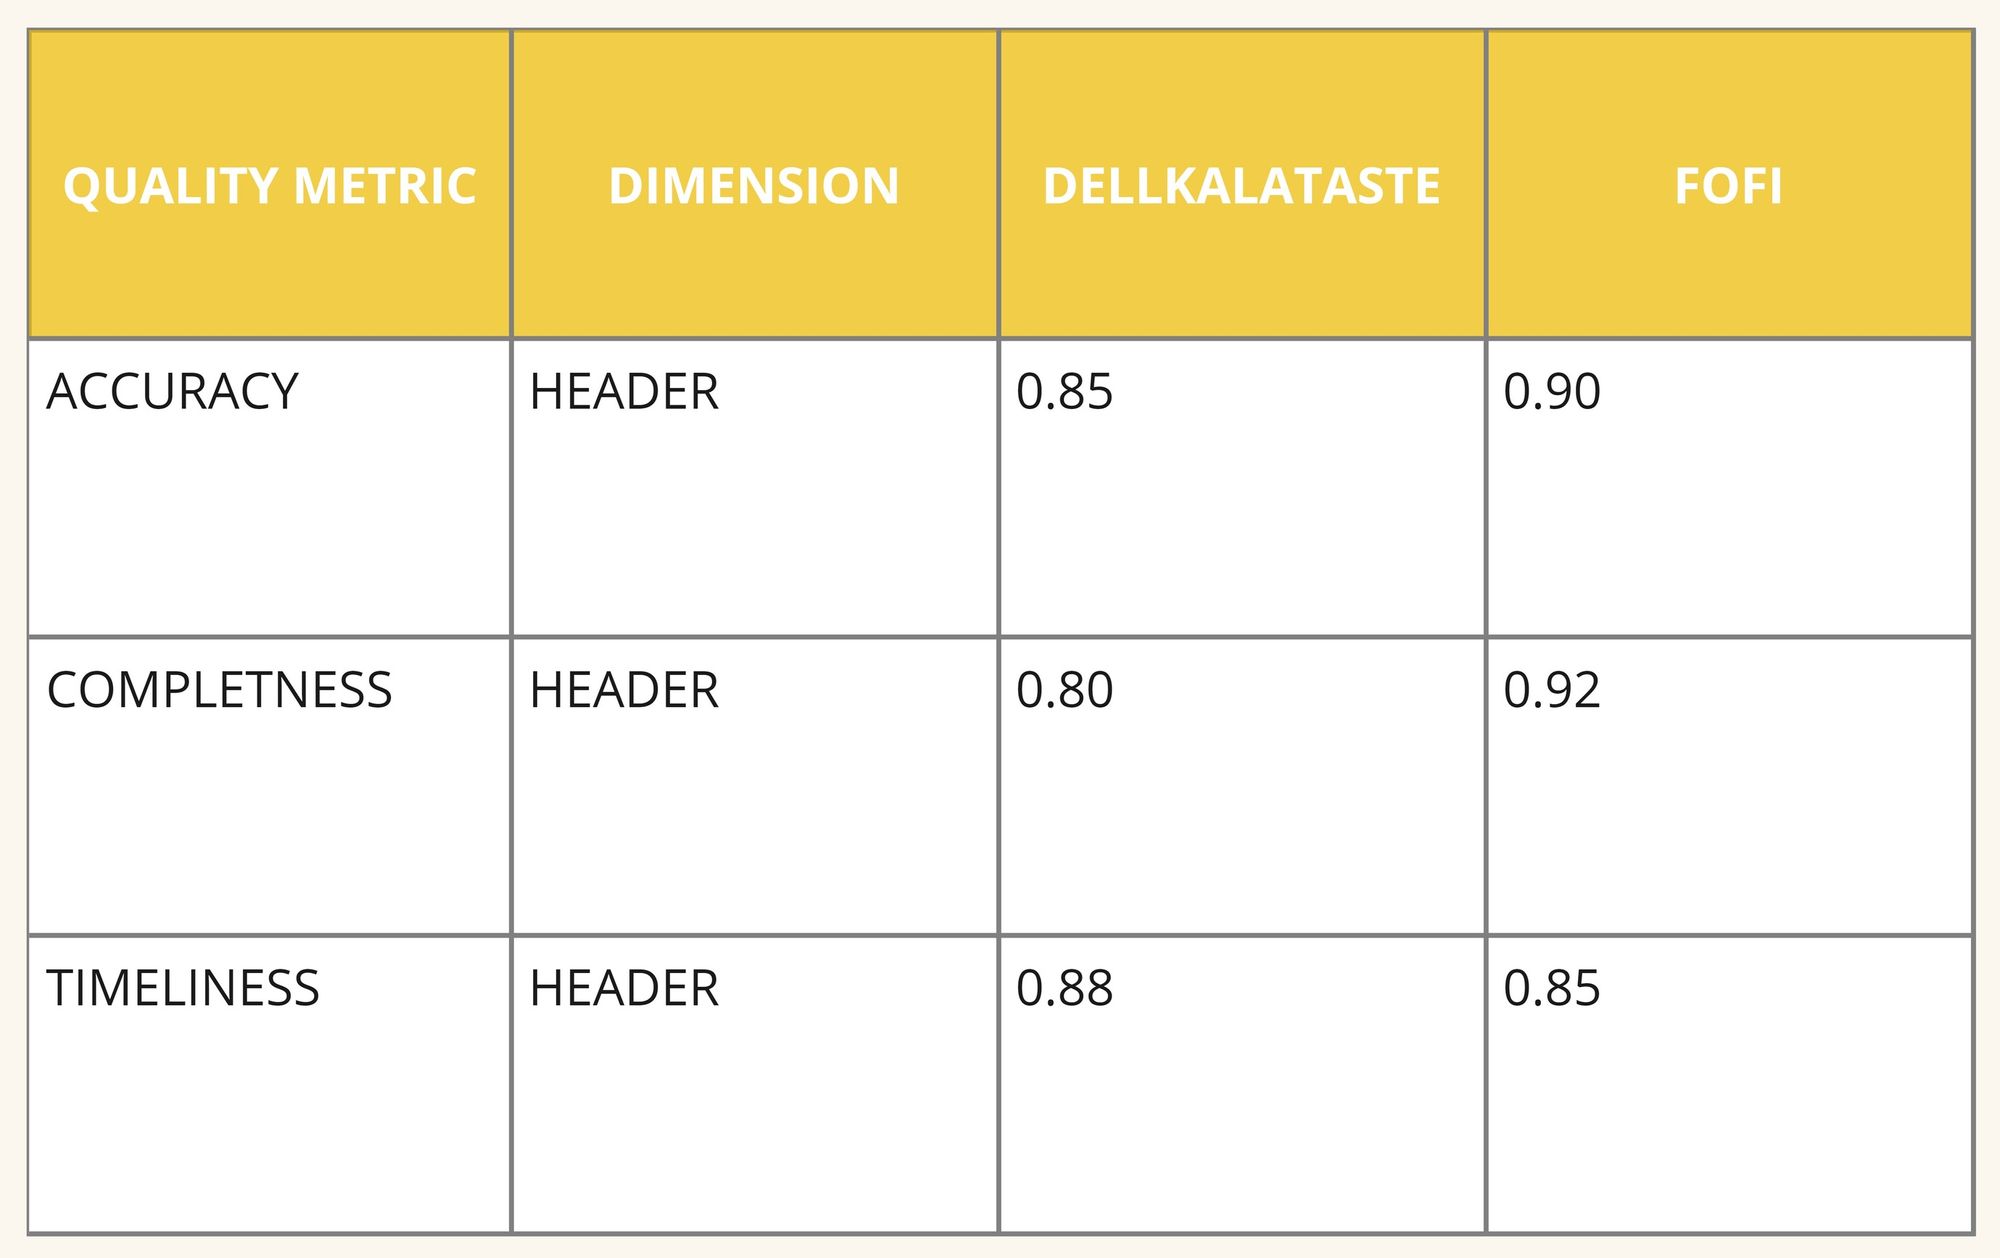
Scorecard For Header
By consolidating the scores, stakeholders can quickly see which provider excels in the areas that matter most to the business. The scorecard can also include contract prices, integration costs, qualitative impacts, and the impact on existing systems to ensure all factors are considered in the decision-making process.
To maintain the relevance and accuracy of the scorecard, it should be periodically updated to reflect any changes in business needs or data priorities. New attributes can be added to the Data Dictionary, and the scorecard framework should be used regularly to reevaluate the current data providers. This ensures that the company remains agile, consistently using the best data sources available.