Lineage driven tasks orchestration
Introduction
According to a new market pulse survey conducted by Matillion and International Data Group (IDG), which drew insight from 200 enterprise data professionals, companies are drawing from an average of over 400 different data sources. It doesn't stop there, but the survey found that, on average, enterprise data volumes are growing by 63 percent a month. This survey also didn’t take into account internal datasets generated internally by the enterprises.
With this growing rate of data assets, it becomes almost impossible to track the data lifecycle and design the correct workflows.
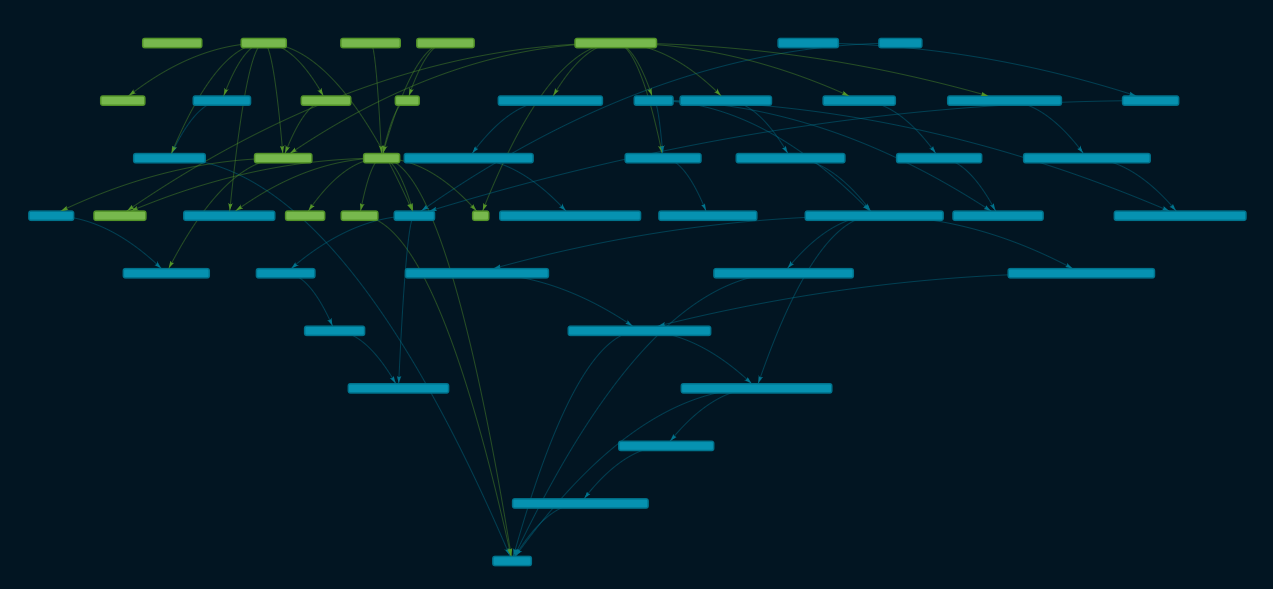
That's when Data Lineage comes in as it essentially gives you a bird's eye view of a data flow which in return facilitates your workflows’ orchestration.
In this article we are going to discuss
- Data Lineage and its use cases
- Workflow orchestration and how data lineage play a role in it
- How did we manage to get full data lineage model and use it on our workflow orchestration
- How we implemented task orchestration guided with data lineage in our system
What is Data Lineage?
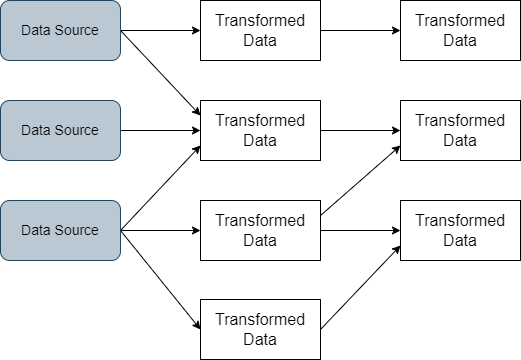
Data lineage is the process of tracking the data lifecycle in your system, from data sources to consumption and any transformation in between. This tracking is then visualized as a graph with data assets represented as nodes, thus giving us visibility of how each data asset was built and aggregated and who is responsible for it and each source transformation.
Data Lineage use cases
Identify important resources
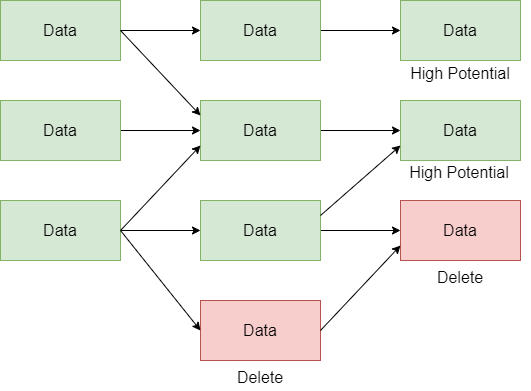
Think about a scenario where you are subscribed to multiple data sources and now you want to evaluate these sources and see if it’s worth keeping your subscription there.
The best way to do that is to take a look at the data that is actually being consumed by your clients and how they impact your business. Afterwards, you can decide which data is useful to your business and accordinly identify what sources are worth keeping.
Impact Analysis
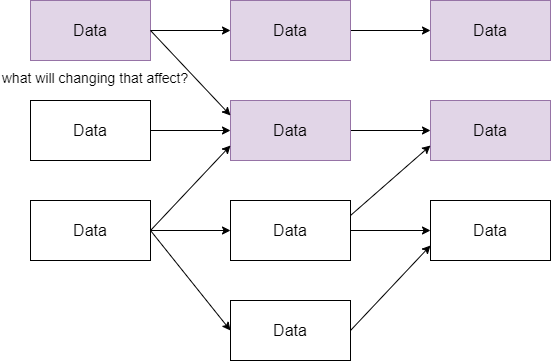
Think of another scenario where you want to change a certain data asset. You will have to keep in mind what other data assets will be affected by that change. You will need to be very careful with your change decisions and will even need to notify and coordinate with all the affected data asset consumers.
Troubleshooting
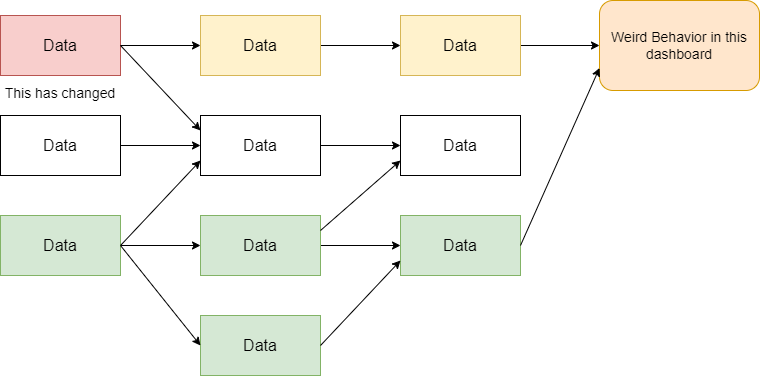
Another very important use case is troubleshooting and diagnosis. Say you see a weird behavior on a certain dashboard, the data lineage visualization will allow you to trace back to the source of any change and pinpoint the problem.
What is Workflow orchestration?
Now that we understand data lineage and its importance we can move on to the next part of the project - workflow orchestration.
A workflow is a set of sequences of tasks that need to be executed in a specific order due to their dependency. Orchestration is the process of automatically running your workflows on schedule and monitor their performance.
How do all the parts fall together…
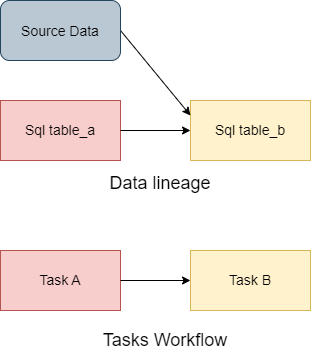
Since our tasks are reading from data assets and creating other data assets, they are essentially building the data life cycle in our system and are tightly coupled with the data lineage.
If we want to know how your workflow should be, you can take a look at your data lineage and it will tell you. For example, if Task B consumes a data asset generated by Task A, then Task B should definitely be executed after Task A. Accordingly, we can say that data lineage can guide in deciding our task hierarchy and thus our workflows.
Creating your own data lineage: Steps breakdown
In order to create our lineage we ask the following questions:
- Where does our data live? In which databases or warehouses?
- What tools or programming languages are used in data transformation?
- How can we collect these queries while assigning them to whatever client dispatched this query?
Once we know the answer to these questions we can start designing our pipeline. For example, if you know that your data lives on Snowflake, you can start utilizing that cloud platforms features to your advantage and search for ways to pull out the query execution history by each client. However, if you use DBT for transformations, then DBT does the work for us as it keeps track of the data lineage.
Raisa Data Lineage pipeline
As for our system we know the data lineage comes from two sources:
- Data stored in SQL server has its transformations done through python tasks.
- Data stored in Snowflake has its transformations done with DBT
Let’s discuss how we are going to handle each of those and then how we are going to merge them to get full lineage.
Generic pipeline
A proposed pipeline for a custom lineage driven task orchestration system would be as follow:
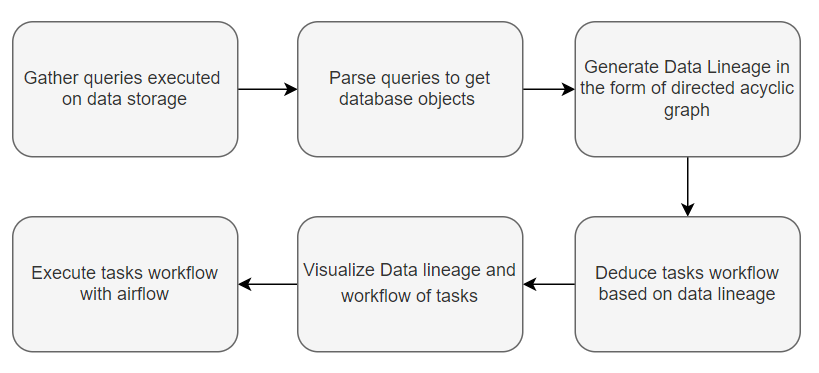
Python tasks with SQL Server lineage
For our python tasks we needed to create our own data lineage.
Let's see how we made use of this pipeline!
- For gathering queries, we used SQL Extended Events to get the query history as well as get the python task that dispatched the query.
- We implemented a SQL queries parser to collect tables names and generate metadata for each python task.
Now we are going to discuss both of these steps in more detail.
Extended Events
SQL server extended events is a tool built inside SQL server used for monitoring specified events and their associated data.
Main building blocks
- Events
An Event is the triggers on which the extended session start taking specified actions. For our use case, the Events are SQL statement or stored procedure execution, so upon the execution of a SQL query the session is triggered.
- Actions
An Action is a programmed response to an event. We wanted to capture SQL text, database name and client application name, where both the database name and the client application name can be defined in the connection strings
- Targets
A Target is the event consumer. With each event trigger, data is gathered and this data needs to be stored somewhere.
Extended Events provide multiple targets that can be used to direct event output to a file or memory buffer. We used files on disk as a target, and later loaded the files into a table.
- Predicate
A Predicate is a filter applied to events such as capturing SQL queries dispatched by client applications with specific name or database related queries excluding server setup such as setting up a connection or checking for locks.
CREATE EVENT SESSION [PythonTasksLogs] ON SERVER
ADD EVENT sqlserver.sql_statement_starting(
ACTION(sqlserver.client_app_name,sqlserver.database_name,sqlserver.sql_text)
WHERE (
        [sqlserver].[like_i_sql_unicode_string]([sqlserver].[client_app_name],N'%python_task::%') AND
        [sqlserver].[like_i_sql_unicode_string]([sqlserver].[sql_text],N'%select%')
    ))
ADD TARGET package0.event_file(SET filename=N'logs.xel',max_file_size=(10),max_rollover_files=(3))
WITH (
    MAX_MEMORY=4096 KB,
    EVENT_RETENTION_MODE=NO_EVENT_LOSS,
    MAX_DISPATCH_LATENCY=30 SECONDS,
    MAX_EVENT_SIZE=0 KB,
    MEMORY_PARTITION_MODE=NONE,
    TRACK_CAUSALITY=ON,
    STARTUP_STATE=ON
)
GO
These excel files are then parsed and loaded into a SQL table.
Advantages:
- Gathered Queries are raw, independent of the method of executing this query. This means that it is independent of the package or method that executed the query and even the programming language used.
- Minimal code change, only adding an App field to the connection string, so the session will be able to recognize the client executing this query. Other methods such as logging will require manually adding logging lines for each executed query and will also require maintenance in case the query changed or adding new functions programmers would add the logging lines themselves.
cnxn = pyodbc.connect(\
    "Driver={DRIVER_NAME};"
    "Server=server_name;"
    "Database=database_name;"
    "uid=username;"
    "PWD=password;"
    "App=pyhton_task::task1;")
Limitations:
- Limited file size as you can only ever specify limited size for your target files and although that protects your disk space it might rollover previous logs that in some cases you didn’t get the chance to parse and save
- Inserts with some pandas functions are translated into parameterized stored procedures which causes a lot of unnecessary logging and in case of large data frames insertion might rollover other logs
- Logging a lot of data to the disk will potentially increase task execution time
Parsing Queries and Generating Metadata
Now that we have the logs table, we can parse executed queries by each task to get the tables names. For this we built a class on top of sql_metadata package.
The package handles getting table names in nested queries, excluding common table expression (CTE) names (not considering them as tables), ignoring inline comments as well as block comments.
We need to also Identify whether the query was reading or writing so we assign the table type (input or output) according to the last SQL keyword (SELECT, INSERT.. etc.) that appeared before the table name.
At the end of this step we are able to gather for each task its input database objects and output database objects and these objects type (BASE TABLE or VIEW).
"task1": {
    "input": [
        {
            "_entity_name": "table_a",
            "_entity_type": "BASE TABLE",
            "_database_name": "db",
            "_schema_name": "dbo",
            "_generated_by": null
        },
        {
            "_entity_name": "table_b",
            "_entity_type": "BASE TABLE",
            "_database_name": "db",
            "_schema_name": "dbo",
            "_generated_by": null
        }
    ],
    "output": [
        {
            "_entity_name": "table_c",
            "_entity_type": "BASE TABLE",
            "_database_name": "db",
            "_schema_name": "dbo",
            "_generated_by": "python_task"
        }
    ]
}
DAGs
We want to represent our data lineage and tasks workflow in the form of a graph with dependencies as edges that has logical processing order for its nodes.
We must ensure that our graph has no cycles otherwise we won’t be able to have this processing order, and to achieve that we used topological sorting algorithm.
Note: processing tasks means executing them, while for data nodes it means generating or updating this database object.
Data Lineage DAG
Assuming that each task is responsible for creating one table as output, then all the input tables to this task had contributed to the creation of this output table.
So we start building the DAG in which the output database objects are considered nodes, where if task1 read from table_a and table_b to generate table_c then we can imply that table_c is dependent on table_a and table_b.
nodes:
{
    table_c:{
        task_name: "task1",
        repo_url: "repo_url",
        ins: 2
        outs: [table_d]
    }
    .
    .
},
edges: [ (table_a, table_c), (table_b, table_c),(table_c, table_d) ]
Tasks workflow DAG
From Data Lineage DAG we can easily create similarly structured objects, but with tasks as nodes , since we already have database object dependencies and we also know which task is responsible for which database object creation.
In the previous example task1 generates table_c. So if task2 reads from table_c then task2 is dependent on task1.
nodes:
{
    task1:{
        repo_url: "repo_url",
        ins: 0
        outs: [task2]
    }
    .
    .
},
edges: [ (task1, task2) ]
Data Build Tool (DBT) lineage
DBT provides an easy way to create, transform, and validate the data within a data warehouse.
As mentioned above the second source of data lineage is DBT transformations done on Snowflake, we need also to get its lineage and merge it with python tasks data lineage.
How to keep track of DBT lineage?
DBT keeps track of its lineage and writes it to a manifest.json file. We just needed to parse the file and convert it to the same DAG format we used for our python lineage in order to get the full lineage.
Now we can merge them together and have a DAG object with the full lineage!
Visualizing DAGs with pyvis
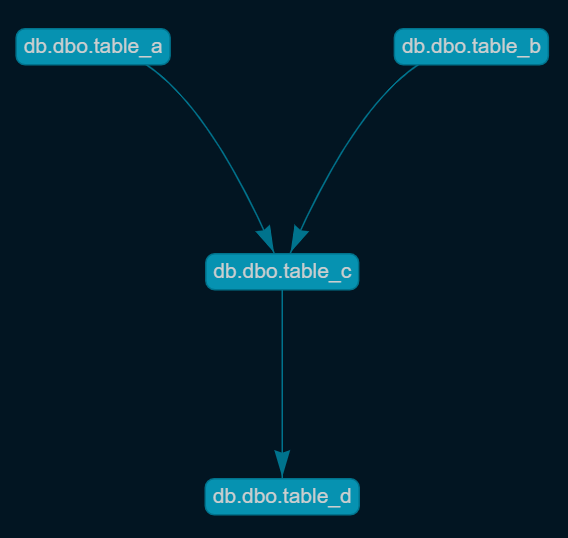
The pyvis library is meant for quick generation of visual network graphs with minimal python code. It is designed as a wrapper around the popular JavaScript visJS library.
For our lineage we used hierarchical layout for the graph to demonstrate the order in which either tasks should be executed or the database objects should be generated and refreshed.
def visaulize_dag_hierarichal(edges: List[List], nodes: dict,
                              nodes_order: List[List], dir: str) -> None:

    # setting layout to true makes the network have heirarichal structure
    nt = Network(height='100%', width='100%', directed=True,
                 layout=True, bgcolor='#021522', font_color="#cccecf")

    # nodes order is list of lists returned by topological sort
    # each list represent a level
    # set level attribute for each network node
    for idx, sub_group in enumerate(nodes_order):
        for node in sub_group:
            color = "#0692b1" if nodes[node].type == 'BASE TABLE' or 'DBT Task' else "#77b84d"
            nt.add_node(node, color=color, name=node, level=idx,
                        shape='box', title="Text to show on hover over node")

    for edge in edges:
        nt.add_edge(*edge)

    nt.show_buttons(filter_=["physics"])
    nt.show(dir+'.html')
The Visualization output is a html web page where you can zoom into nodes, drag them around and also highlight clicked node.
Visualizing our full Lineage using DBT docs
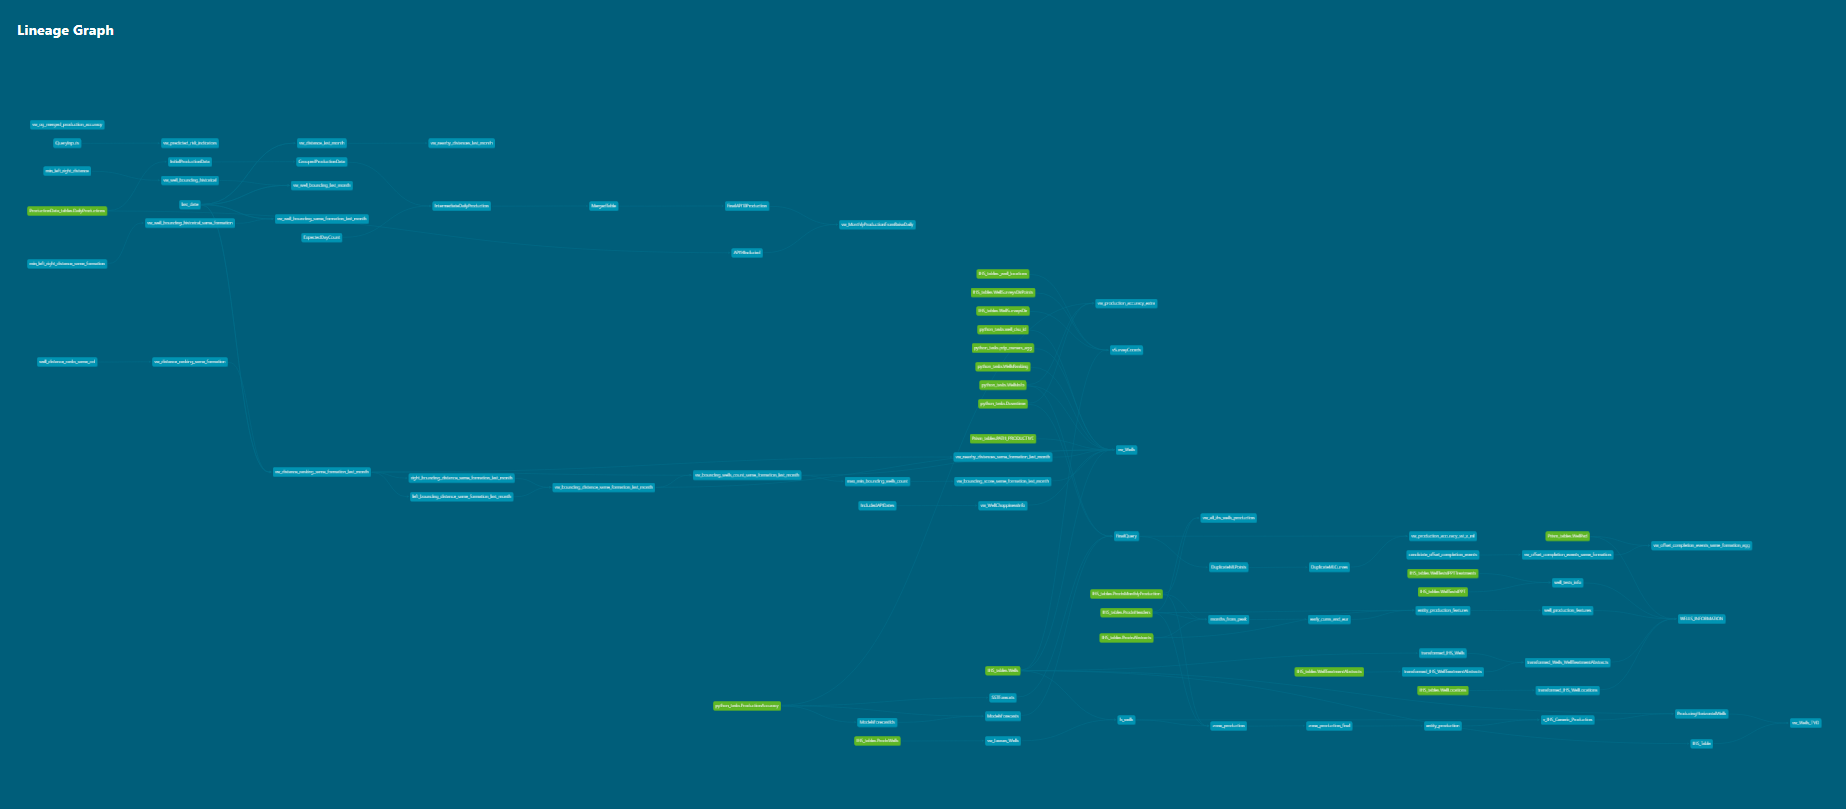
DBT docs offers a very powerful visualization for its lineage with very rich features such as
- Edges overlapping is highly optimized, you won’t see overlapping edges unless there is no other way, Also Nodes placement is very smart as they are always as near as possible to its upstream and downstream data assets where as our hierarchical visualization didn’t offer either and nodes where placed systematically on each level
- Focusing on a certain node and only view related downstream and upstream nodes
- Tagging nodes with a certain tag and then show them only or even hide them
- View columns of each asset, some statistics (like last materialization date)
To take advantage of these features we decided to inject our lineage into the DBT manifest.json and catalog.json which its docs engine uses to create the user interface.
So after we Inspected these files(manifest.json and catalog.json) we added our data nodes to it in the same format. Also we unified our data source names in both python and DBT in order for the lineage to be correct and if DBT considered a python generated table a source we changed it into a model as we now have this sort of knowledge.
After the full injection of python data assets we just served the docs and displayed the full lineage in the browser.
Orchestration tools: Airflow
Introduction
Airflow is a tool to programmatically author, schedule and monitor workflows.
It has a lot of useful functionalities including:
- Running multiple tasks in parallel either on the same computer node or remote nodes
- Metrics to control task retries, running instances of the same workflow, maximum time for a task to complete…etc.
- Rich Web UI, to gain visibility about the status of your workflows
Airflow core concepts
- DAG
Directed Acyclic Graph. An Airflow DAG is a workflow defined as a graph, where all dependencies between nodes are directed and nodes do not self-reference.
- Task
A step in a DAG describing a single unit of work.
- Operator
Describes a task behavior. For example, Python Operator takes a python callable function to execute where as a Bash Operator takes a bash command to execute.
- Sensors
Special operators, which pause the execution of dependent tasks until some criteria is met.
Our requirements
Since our tasks are either
- python tasks that has isolated repositories that run on a certain conda environment
- DBT models to materialize
We decided to rely on the bash operator to execute a script that:
- Pulls the most recent repository
- Activates a repository conda environment
- Runs a python file with the command or dbt command to materialize a model
if [[ ! -e task1 ]]; then
    git clone https://username:pwd@repo_url
elif [[ ! -d task1 ]]; then
    git pull https://username:pwd@repo_url
fi
conda activate python_env
cd ~/airflow/repos/task1
python `find ./ -name "main.py"`
source ~/miniconda3/etc/profile.d/conda.sh
conda activate dbt_env
dbt run --select dbt_model1
Automating Airflow DAG creation
Since we want to have minimal code and minimum maintenance to execute our workflows in the right order we made use of the Dag Factory package.
The package uses a yml file which is simply a template that holds:
- Airflow DAG configuration which can be configured dynamically by a parametrized python
- Tasks dependency which we already conclude from our Lineage
- Bash command which is also parametrized with tasks names and types
dag_yml:
  catchup: false
  default_args:
    owner: example_owner
    retries: 1
    retry_delay_sec: 300
    start_date: '2022-11-01'
  description: this is an example dag!
  schedule_interval: '*/1 * * * *'
  max_active_runs: 1
  tasks:
    task1:
      bash_command: '/home/airflow_user/airflow/run_task1.sh '
      operator: airflow.operators.bash_operator.BashOperator
    task2:
      bash_command: '/home/v/airflow/run_task2.sh '
      dependencies:
      - task1
      operator: airflow.operators.bash_operator.BashOperator
    task3:
      bash_command: '/home/airflow_user/airflow/run_task3.sh '
      dependencies:
      - task2
      operator: airflow.operators.bash_operator.BashOperator
    task4:
      bash_command: '/home/airflow_user/airflow/run_task4.sh '
      dependencies:
      - task3
      operator: airflow.operators.bash_operator.BashOperator
    task5:
      bash_command: '/home/airflow_user/airflow/run_task5.sh '
      operator: airflow.operators.bash_operator.BashOperator
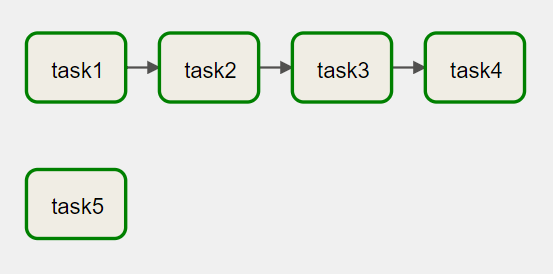
This way each time we execute our data lineage pipeline, our tasks DAG will be up to date with the data lineage.
Summary
In this article, we discussed the importance of data lineage and how it can be used to create our tasks as an airflow DAG dynamically. Then, we went through how we actually implemented this in our system.
Reference Links
https://www.castordoc.com/blog/what-is-data-lineage
https://www.astronomer.io/blog/what-is-data-lineage/#task-hierarchy-versus-data-lineage
https://www.sqlservercentral.com/blogs/sql-querying-xml-attributes-from-xml-column
https://www.askpython.com/python/examples/customizing-pyvis-interactive-network-graphs
https://medium.com/analytics-vidhya/getting-started-with-airflow-b0042cae3ebf

